
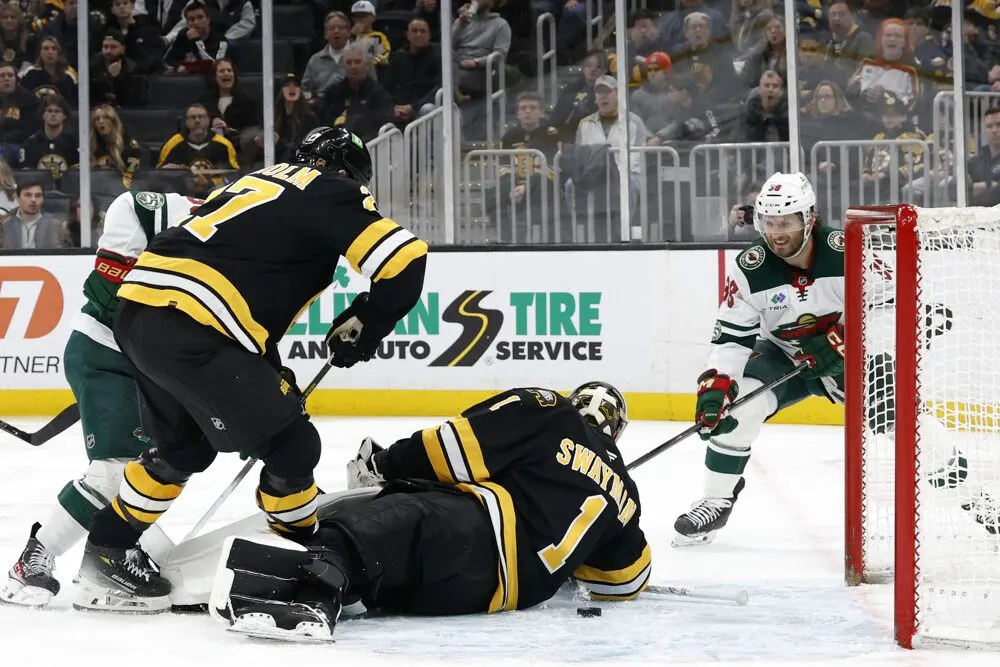

The Bruins beat Nashville 6-0 on Thursday and are 8-2-1, top of the Atlantic with 17 points. They have outscored opponents 42-22, the best goal differential in the NHL and six goals clear of anyone else. Seven of their eight wins have come by two goals or more.
Now the other number. By MoneyPuck's expected goals, Boston has created 34.4 goals' worth of chances in all situations and allowed 34.5. On chances alone, the Bruins are a dead-even team. The 20-goal gap between those two lines is the biggest in the league, and almost two thirds of it is sitting in the crease.
How is a team plus-20 on even chances?
Two ways, and Boston is doing both. Its shooters have scored 7.6 more goals than their chances were worth, second in the league behind Edmonton. Its goaltenders have allowed 12.5 fewer than the shots against them were worth, the most of any team.
The percentages tell the same story in a simpler way. Boston is shooting 15.0 per cent in all situations, second in the NHL, and stopping 92.9 per cent of the shots it faces, first. No team keeps both of those numbers near the top for a full season.
That does not make the start fake. The points are banked. The question is what Boston looks like when the percentages come back to the pack, and the answer depends on which half of the gap is real.
Haven't we seen this before?
We have. In September we called Boston the luckiest team in hockey, and the numbers from last season still hold up. The Bruins finished with 100 points while controlling 47 per cent of the expected goals. They beat their expected goal differential by about 51 goals, roughly 20 on finishing and 31 on goaltending.
| Boston Bruins | 2025-26 | 2026-27 |
|---|---|---|
| Five-on-five expected goals share | 47% | 53.7% (9th) |
| All-situations expected goals share | 47% | 49.9% (15th) |
| Goals above expected, finishing | +20.4 | +7.6 |
| Goals saved above expected | +30.6 | +12.5 |
Look at the top row. At five-on-five, Boston has gone from a team that was outchanced to one that wins the chances, ninth in the league. The improvement is almost all on offence. The Bruins rank seventh in five-on-five expected goals for per 60 minutes and 18th in expected goals against.
So this is not a straight repeat. The skaters are better than last season's group. The goaltending is doing exactly what it did last season. And the special teams are dragging the all-situations number back to 50 per cent.
How much of this is the goaltending?
Most of it, and that is not a criticism. Jeremy Swayman saved 28.8 goals above expected last season, second in the NHL behind Logan Thompson. Through eight starts this season he is at plus-7.7, fourth in the league, with a .928 save percentage.
| Boston goaltender | Starts | Record | Saves / shots | Save % | Goals saved above expected |
|---|---|---|---|---|---|
| Jeremy Swayman | 8 | 6-1-1 | 206 / 222 | .928 | +7.7 |
| Michael DiPietro | 3 | 2-1-0 | 79 / 84 | .940 | +4.5 |
The new part is behind him. Boston traded Joonas Korpisalo to the Rangers in the preseason. Korpisalo started 31 games last season and finished 1.0 goals below expected. His replacement is Michael DiPietro, a 27-year-old who played one NHL game last season and has spent most of the four years since Boston acquired him from Vancouver in the minors. In three starts he has a shutout, a .940 save percentage and 4.5 goals saved above expected.
DiPietro will not stop 94 per cent of shots over a season. Nobody does. But the bar he has to clear is low and important. Boston has a heavy run of back-to-backs, and a backup who is merely average instead of slightly below it is worth several points over a season. Two years of Swayman numbers say the starter is one of the best in the world. A competent backup is what turns that into a season-long edge rather than a 55-game one.
That is why we think a good chunk of Boston's gap is real. Goaltending is the one part of the luck column that can be a skill, and Boston's has beaten the model for 93 games running.
What has changed in front of the goalies?
More than the record suggests, and it is spread around. David Pastrnak, the new captain, has 16 points in 11 games and the team has 56 per cent of the expected goals with him on the ice at five-on-five. He is also the one player running well above his chances, with six goals on 3.6 expected. Nobody else on the roster is more than 1.3 goals ahead of his expected total, so the finishing edge is a team-wide nudge rather than one player on a heater.
| Bruins skater | Points | Goals | Expected goals | Five-on-five xG share |
|---|---|---|---|---|
| David Pastrnak | 16 | 6 | 3.6 | 56% |
| Fraser Minten | 8 | 4 | 3.0 | 51% |
| Morgan Geekie | 8 | 1 | 2.7 | 50% |
| JJ Peterka | 7 | 4 | 3.7 | 58% |
| James Hagens | 7 | 3 | 2.8 | 52% |
| Hampus Lindholm | 4 | 1 | 0.6 | 58% |
JJ Peterka, the summer's big addition, is doing what Boston paid for. The Bruins have 58 per cent of the expected goals with him on the ice. Hampus Lindholm leads the team in five-on-five ice time and is also at 58 per cent, with Boston outscoring opponents 12-5 in his minutes.
The young centres are carrying real minutes. Fraser Minten has four goals, James Hagens has seven points in 11 games, and Matthew Poitras has four goals in eight games on under 11 minutes a night.
The one forward going the other way is Morgan Geekie. After the 39-goal season we argued would not repeat, he has one goal on 2.7 expected. His assists have kept his point total healthy, and his chances suggest a few goals are coming.
Then there is Charlie McAvoy. Boston went 4-2 while he served the six-game suspension and is 4-0-1 since he came back. In five games the Bruins have 62 per cent of the expected goals with him on the ice, the best mark on the team. Nikita Zadorov is also back after missing a game, so Boston finally has its full top four available.
Where are the cracks?
Shot volume and the penalty kill. Boston is allowing 28.0 shots a game, 21st in the league, and has 48 per cent of the five-on-five shot attempts, 20th. It wins the expected goals because its chances are better, not because it has the puck more.
The penalty kill has allowed six goals in 48.6 minutes and ranks 19th in expected goals against per 60. The power play has scored seven times, but its chance creation ranks 22nd, so that output is the finishing luck again. Together the special teams turn a 54 per cent five-on-five team into a 50 per cent team overall.
None of that sinks a team with Swayman in net. It does put a ceiling on what the record means in April and May.
The case that Boston is a contender, stated fairly
The case for believing in Boston is strong. The five-on-five play has improved by almost seven points of expected goals share, McAvoy is back and driving play, Peterka has fit straight in, and the goaltending has beaten the model by more than 40 goals across 93 games. At some point a pattern that long stops being luck and starts being the best goaltending tandem in the league.
The case against is the shots. A team that loses the attempt battle, sits 21st in shots against and has a below-average penalty kill is relying on its goalie every night. Swayman can do that for a regular season. Playoff series tend to expose it, and a 15 per cent shooting team will not stay that way when the checking tightens.
Our view is that Boston is a genuine playoff team and a top-three seed in the Atlantic, built on the best goaltending situation in the East. It is not yet a Cup favourite, and it will not be until the penalty kill and the shot share catch up to the goalies.
What to watch
DiPietro's workload through the back-to-backs, because his level decides whether Swayman reaches the spring fresh. McAvoy's minutes and the five-on-five shot share with him back in the lineup. And the penalty kill, the weakest part of the team and the easiest to fix. Every Bruins number is on the team stats page, and the Atlantic race is on the standings.